Historical Test
We have processed data sets from many securities over the past 5 years so that we can validate that ghost patterns existence just before major economic and geo-political events. We have consistently seen ghost patterns emerge just before major price moves indicating that insiders have foreknowledge of events that are yet to occur and they are trading these events.
We have compiled a short list of a sample set of ghost pattern events and outline the circumstances surrounding the events and subsequent price moves.
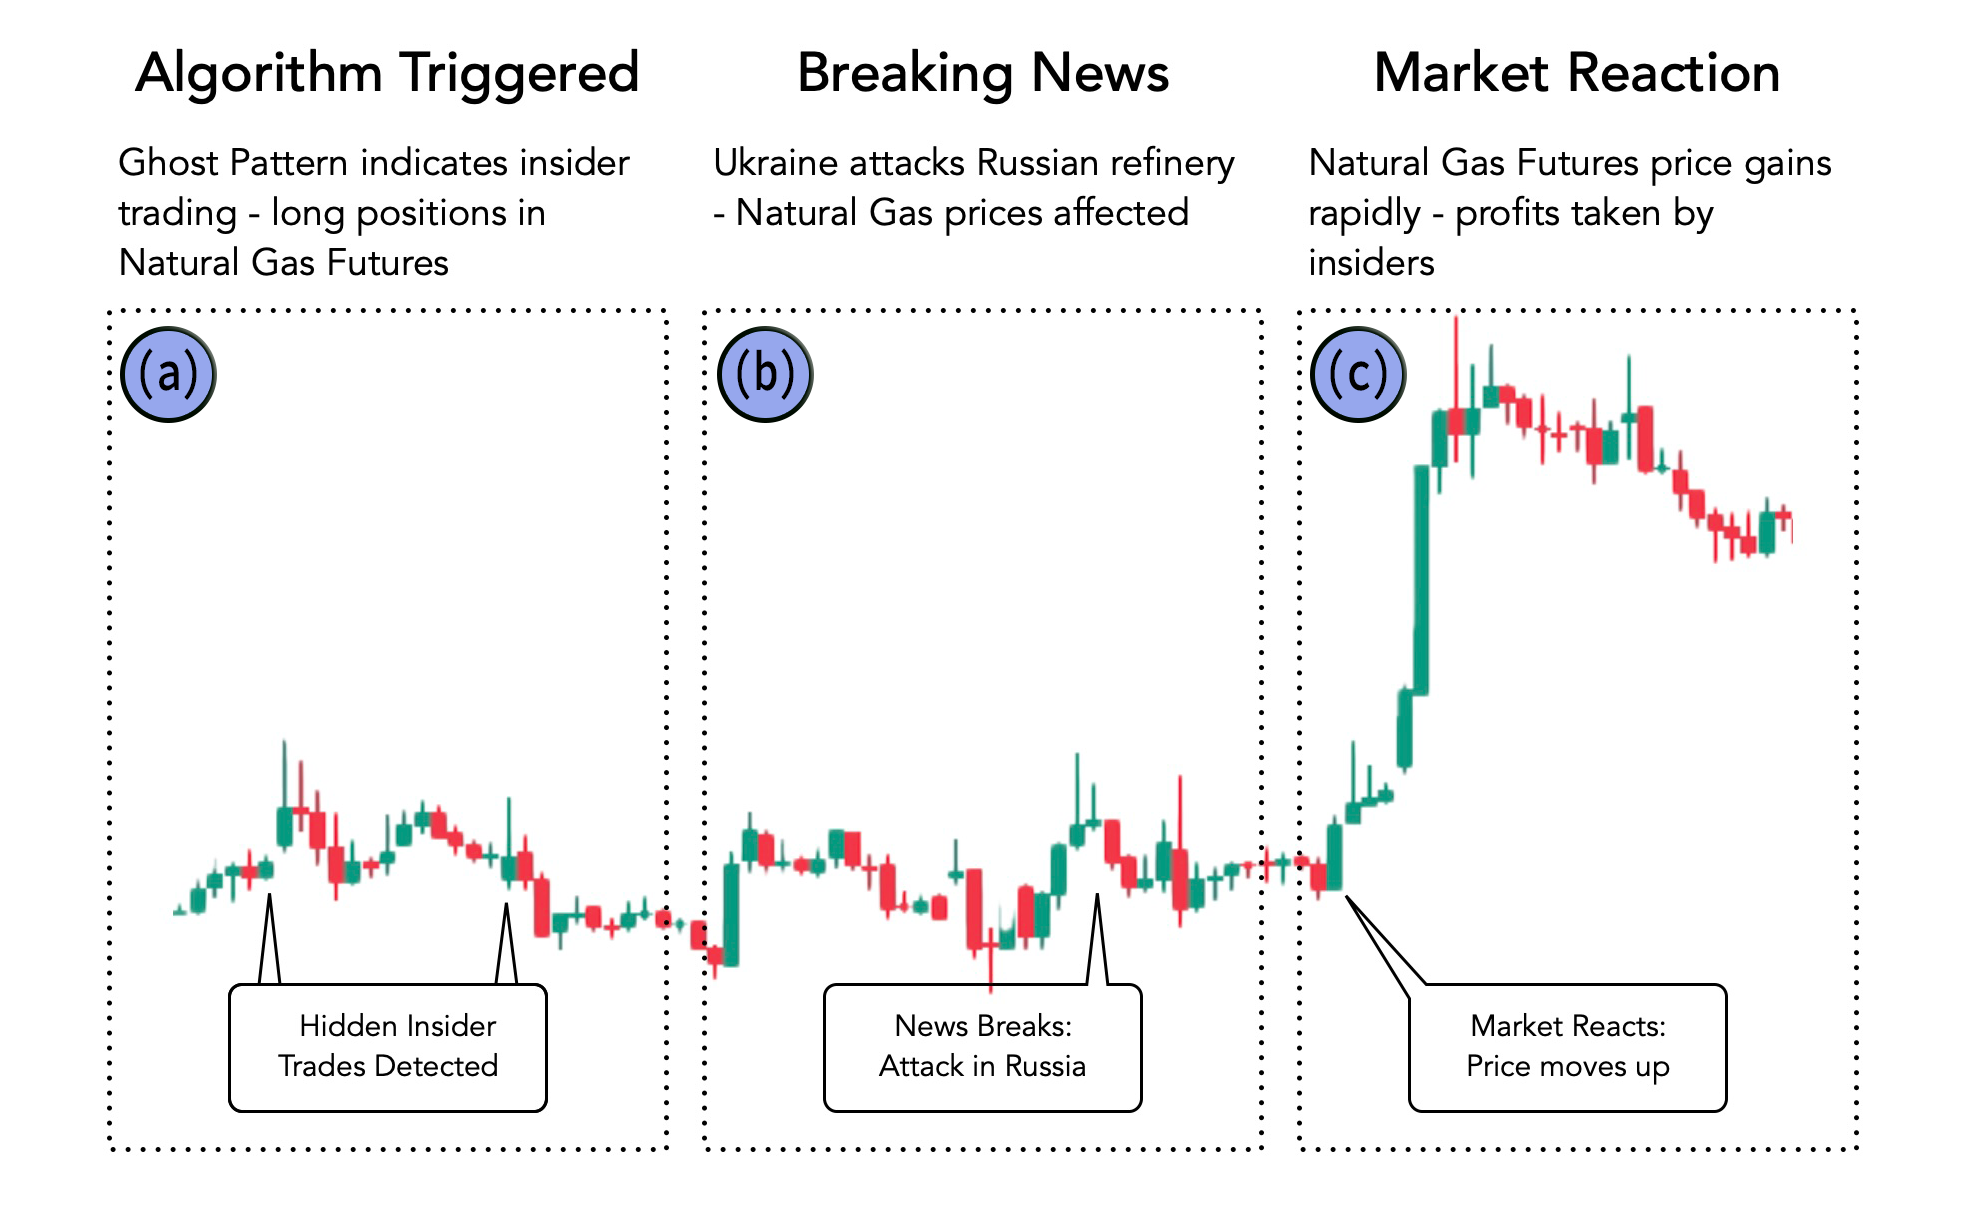
In order to understand the predictive nature of our ghost patterns we must first describe the Anatomy of a Ghost Pattern.
Here’s how the Ghost Pattern works:
(a). The algorithm identifies significant insider trades in a particular stock and tracks whether those trades are buys or sells.
(b). Bimini Road then monitors the pattern until the insider activity halts, which can last for months, weeks, days, or even hours, depending on whether the chart is daily or intraday.
(c). Once an external event impacts the market, the stock price moves in the direction previously indicated by the Ghost Pattern. For example, if insiders were buying the stock, the price will rise. This movement often happens swiftly, triggered by breaking news from sources like Bloomberg, FT, Benzinga, CNBC, SeekingAlpha, or ZeroHedge.

Backtest: Boeing Drops 75%

Bimini Road identified a Ghost Pattern in September and again in December of 2019 that lasted 28 and 32 days respectively indicating two large selling events by insiders on Boeing stock.
The last Ghost Pattern ended in January 2020. The U.S. Government announced a global pandemic event and shortly thereafter countries around the world began restricting travel.
The price of Boeing stock along with almost all U.S. stocks began to plummet rapidly on the news beginning the first global pandemic in nearly 100 years.
Historical Timeline
September to October 2019 - Ghost Pattern captures 28 days of selling
December to January 2020 - Ghost Pattern captures 32 days of selling
February 2020 - COVID-19 Announced / Global shutdown / All air travel is restricted
Price Moves Down - Boeing Drops 75%
Backtest: Exxon Gains 250%

Bimini Road identified a Ghost Pattern in October 2020 that lasted 28 days indicating a large buying event by insiders on Exxon stock.
The Ghost Pattern ended in November 2020. The U.S. Government grants Emergency Use Authorization to the Pfizer vaccine and shortly thereafter countries around the world begin easing travel restrictions and travel resumes pushing the demand for oil up.
The price of Exxon stock along with other U.S. stocks begins to recover rapidly on the news kicking off the global pandemic recovery.
Historical Timeline
October to November 2020 - - Ghost Pattern captures 28 days of buying
December 11, 2020 - U.S. Gov grants Emergency Use Authorization to Pfizer Vaccine
Price Moves Up - Exxon gains 250%
Backtest: Raytheon Technologies Gains 38%

Bimini Road identified a Ghost Pattern in December 2020 that lasted 31 days indicating a large buying event by insiders on Raytheon stock.
The Ghost Pattern ended in January 2021. The news outlets report that Russia is beginning to move troops and equipment to the Ukrainian border indicating that an invasion of the Ukraine is probable. Shortly thereafter the price of Raytheon Technologies stock begins to go up on the news gaining 38%.
Historical Timeline
December to January 2021 - Ghost Pattern captures 31 days of buying
March 2021 - Early March 2021 - Russia begins moving troops & equipment to Ukrainian Border
Price Moves Up - Raytheon gains 38%
Backtest: Raytheon Technologies Gains 39%

Bimini Road identified a Ghost Pattern in January 2024 that lasted 33 days indicating a large buying event by insiders on Raytheon stock.
The Ghost Pattern ended in March 2024. The news outlets report that Israel has attacked the Iranian embassy in Syria indicating an escalation in the middle east conflict. Shortly thereafter the price of Raytheon Technologies stock begins to go up on the news gaining 39%.
Historical Timeline
January to March 2024 - Ghost Pattern captures 33 days of buying
April 1, 2024 - Israel strikes Iranian embassy in Syria
Price Moves Up - Raytheon gains 39%
Backtest: NVIDIA Gains 833%

Bimini Road identified Ghost Patterns in December 2022 and March 2023 that lasted 37 and 46 days respectively. In this case the news preceded the ghost patterns. We believe that because A.I. is such new and different technology, insiders were not aware of its impact until it was released. In fact many of the engineers working on the Large Language Model technology did not expect it to work at all. They began to see emergent behavior that was not part of the programming.
The last Ghost Pattern ended in May 2023 when a well known New York City hedge fund manager was quoted as saying “where going up” referring to NVIDIA the maker of all A.I. chips. Shortly thereafter the price of NVIDIA stock began to go up rapidly gaining 833%.
Historical Timeline
December to February 2023 - Ghost Pattern captures 37 days of buying (On November 30, 2022 OpenAI releases ChatGPT to the world.)
March to May 2023 - Ghost Pattern captures 46 days of buying (On March 23, 2023 NVIDIA announces demand for GPU’s is growing fast)
May 30, 2024 - Steven Cohen quoted saying “where going up” referring to NVIDIA (Cohen is a high profile hedge fund billionaire in NYC).
Price Moves Up - NVIDIA gains 833%
Below is a link to an editorial style PDF written to better digest the back tests and their effects.
Bimini Road Back Test Sheets Download Link - easy viewing on mobile & desktop
Join Us in Shaping the Future
We are seeking visionary investors to help build one of Atlanta’s most revolutionary FinTech startups. With your support, we will lay the foundation for industry-changing products that redefine how people interact with money.
Interested in being part of this journey? Contact us here. Together, we can reshape the financial landscape.
